英语作文啦www.zuihuowenan.com雅思频道特为大家收集整理了雅思写作Task1饼状图考官范文。认真研读一定的雅思范文及作文模板可以帮助我们检验自己的写作水平,并能很好地吸收和应用优秀范文里的优秀内容~更多雅思报名官网的最新消息,最新、最专业的雅思备考资料,英语作文啦www.zuihuowenan.com将第一时间为大家发布。
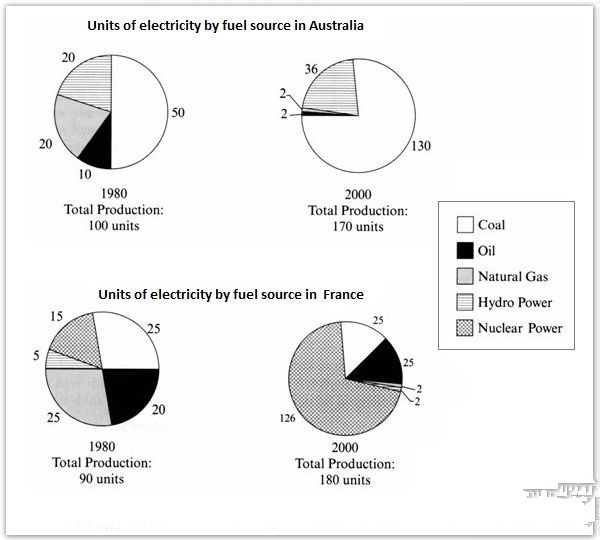
The pie charts below show units of electricity production by fuel source Australia and France in 1980 and 2000.
Summarise the information by selecting and reporting the main features, and make comparisons where relevant.
Sample Answer:
The given pie charts shows data on the electricity production from fuel sources in Australia and in France in 1980 and 2000. As is observed from the pie charts, coal was the main source for electricity production in Australia while France used the Nuclear Power more in recent years to produce their electricity demand.
According the given data, Australia produced 100 units of electricity in 1980 and 170 units in 2000 while the production in France was 90 units and doubled in the year 2000.
In Australia coal was the main source of electricity production and half of the total electricity produced came from coal in 1980. Natural gas and hydro power contributed of producing 20 units of electricity while remaining 10 units was produced from oil. The dependency on coal increased in 2000 for electricity production while oil and natural gases were very minimally used for electricity production. Nuclear power was not used in Australia as source for producing electricity.
On the contrary, In France natural gas and coal together produced half of the electricity in 1980. The use of nuclear power increased significantly in France in 2000 amounting 126 units in this year compared to the 15 units 20 years back.