英语作文啦www.zuihuowenan.com雅思频道特为大家收集整理了雅思写作Task1饼状图考官范文。认真研读一定的雅思范文及作文模板可以帮助我们检验自己的写作水平,并能很好地吸收和应用优秀范文里的优秀内容~更多雅思报名官网的最新消息,最新、最专业的雅思备考资料,英语作文啦www.zuihuowenan.com将第一时间为大家发布。
The chart and graph below give information about sales and share prices for Coca-Cola.
Write a report for a university lecturer describing the information shown below.

Sample Answer:
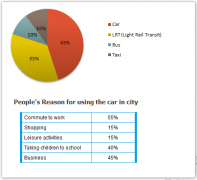
The given pie chart and line graphs show the data on sales volume and share price of Coca-Cola. As is given in the illustration, in the year 2000, Coca-Cola was sold most in America where it had more than 55% sales volume. The share price of Coca-Cola was highest in 1998 and reached to around 55 in 2001 with some fluctuation.
As is presented in the pie chart, in 2000, Coca-Cola had more than 55% sales in Latin and North America. In Europe it had more than 20% sales volume, in Asia 16.45% and in Africa it had 7% sales volume. This indicates that American continent has the largest market for Coca-Cola while this market is least in African Continent.
Again, the share price of Coca-Cola was only $ 33 in 1996 and this price increased to $ 68 in 1997. The price reached to the highest in 1998 when it was $ 80 per share. The price then started dropping and with some fluctuations it reached it around $ 60 in 2001.
In summary, the American Continent was the largest market for Coca-Cola in 2000 and the average share price of it is $60 though this price varies year to year.
(Approximately 202 words)
( This model answer can be followed as an example of a very good answer. However, please note that this is just one example out of many possible approaches.)