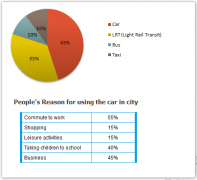
英语作文啦www.zuihuowenan.com雅思频道特为大家收集整理了雅思写作Task1饼状图考官范文。认真研读一定的雅思范文及作文模板可以帮助我们检验自己的写作水平,并能很好地吸收和应用优秀范文里的优秀内容~更多雅思报名官网的最新消息,最新、最专业的雅思备考资料,英语作文啦www.zuihuowenan.com将第一时间为大家发布。
The graphs show changes in spending habits of people in UK between 1971 and 2001.
Write a report to a university lecturer describing the data.


Sample Answer:
The provided pie charts give information on the spending habits of UK citizens in 1971 and 2001. As is observed from the charts, the expenditure on petrol & furniture reduced significantly while the amount spent on computers increased.
Initially in 1971, British people spent 36% on petrol which was the highest percentage among the given expense categories. Their expense on Furniture was second largest (32%) while they spent 25% on restaurants. The least amount spent by them was in computer which was only 7% in this year.
After 30 years in 2001, the expense on petrol and furniture reduced to 8% which is significantly lower than the percentage in 1971. But the expense on computers increased by 5% in 2001. People spent 1% on books in this year. The expenses for restaurant decreased to 14% compared to the 25% in 1971 and this is probably people spent more on food preparing at home. The highest amount spent in 2001 by UK people was in car and that consist almost the half of the total expense in this year.